Fact check: Does half of the U.S. live "in or near poverty"?

January 26, 2016
By Charles Aull
In her official response to President Obama’s State of the Union speech, Green Party presidential candidate Jill Stein stated that half of the U.S. population lives “in or near poverty.” Referring to the economic policies of the White House and Congress over the past seven years, she said, “As a result of this bipartisan assault, we have not had a recovery by any measure. One in two Americans remain in or near poverty ...”[1] Is Stein’s claim accurate? We start with some basics on poverty data.
Measuring poverty in the United States
The U.S. Census Bureau uses two different measures for defining poverty: the official measure and the Supplemental Poverty Measure (SPM). The official measure has been around since the 1960s, and it has remained largely unchanged since then, with the exception of adjustments for inflation. It compares a household’s pre-tax income to a threshold based on three times the minimum food diet as defined by the U.S. Department of Agriculture in 1963. The official measure includes additional forms of income such as social security and pensions but does not include noncash and “near cash” benefits such as Medicare, Medicaid and food stamps. The official measure, as its name suggests, is the federal government’s official measure of poverty and is used for statistical purposes as well as for determining one’s eligibility for certain welfare programs.[2][3]
The SPM is a much newer and more complex measure. Developed in 1995 and officially implemented in 2010, the SPM takes into account expenses such as taxes and child care and government noncash and “near cash” benefits such as those listed above. The SPM also computes factors such as cohabitation and geographical variations in the cost-of-living. The federal government considers the SPM a “research measure” and a “supplement” to the official measure. The Census Bureau releases an SPM report on poverty every year alongside the official report. Both measures have received criticism. The official measure is often regarded as outdated and too exclusive, while the SPM is viewed by some as too inclusive.[2][3]
How do the two measures compare in terms of the data they produce? Since its implementation in 2010, the SPM has consistently shown a higher poverty rate than the official measure. In 2010, for example, the official measure pointed to a poverty rate of 15.1 percent. The SPM showed 16 percent.[4] The table below shows the poverty rates by each measure for 2014. It also shows the poverty threshold by each measure for a family of four. (Note that that the SPM has different thresholds for homeowners with a mortgage, homeowners without a mortgage and renters. The threshold shown below is for homeowners with a mortgage.)[5][6]
| 2014, Official measure | |
|---|---|
| Average poverty threshold | Threshold: Family of four |
| 14.8 percent | $24,008 |
| 2014, SPM | |
| Average poverty threshold | Threshold: Family of four |
| 15.3 percent | $25,884 |
| Sources: U.S. Census Bureau, "Income and Poverty in the United States: 2014," September 2015 U.S. Census Bureai, "The Supplemental Poverty Measure: 2014," September 2015 | |
Americans living “in or near poverty”
According to the Census Bureau’s two measures, is half of the U.S. population living in or near poverty? Let’s start by laying out the data.
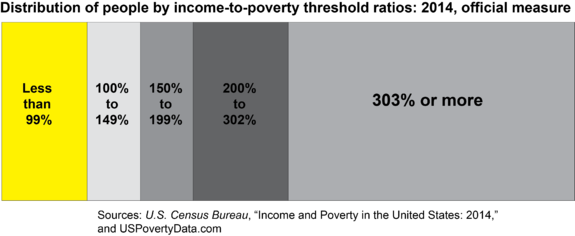
The official measure shows that 14.8 percent of the people living in the United States lived in households with incomes that were 99 percent or less of their respective poverty thresholds in 2014. This means that 14.8 percent of the population—46.7 million people—lived below the poverty line, according to the official measure. Another 9.3 percent lived in households with incomes at 100 to 149 percent of the poverty threshold, while another 9.2 percent lived in households with incomes at 150 to 199 percent. If we add all of this up, it comes to 33.3 percent of the total population. In other words, 33.3 percent of the country lived in households that had incomes at 199 percent of the poverty threshold or lower in 2014. That is quite a bit short of one in two Americans.[5]
According to Matthew Bruening, who writes about poverty on his blog and for the nonprofit Demos and created an online poverty calculator that pulls microdata from the Census Bureau, we would have to include households with incomes up to 302 percent of the official poverty line to get to 50 percent of the population.[7] To put a dollar sign on that, this would include families of four that make $72,504 per year or less.
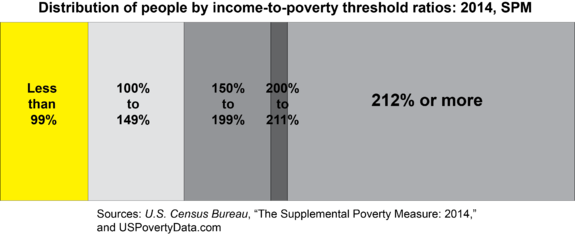
What about the SPM? By this measure, 15.3 percent of the population lived below the poverty threshold. 16.7 percent lived in households with incomes between 100 and 149 percent of the poverty threshold and 15.1 percent lived in households with incomes at 150 to 199 percent. Added up, this totals 47.1 percent.[6] To get to one in two, Bruening told us that we would need to include households that earned up to 211 percent of the supplemental poverty line.[7] This would include families of four making up to $54,615 per year.
Near poverty
To say that Stein’s statement is true, we would have to consider—by the official measure—households with incomes between 101 and 302 percent of the official poverty line to be near poverty or—by the SPM—households with incomes between 101 and 211 percent of the supplemental poverty line to be near poverty. Are either of these definitions reasonable?
In short, no. Though no official definition of near poverty exists, we were unable to find a single example of any definition that exceeded twice the poverty threshold. The closest we could find were groups like the Working Poor Project, which defines near poverty as between 100 and 200 percent of the poverty line.[8] But most of the studies that we came across, such as recent ones from the University of Virginia, left-of-center Demos and the right-of-center American Enterprise Institute, defined it as between 100 and 150 percent of the poverty line.[9][10][11] Other studies used definitions that were much lower. A Census Bureau analysis from 2014, for instance, notes that the Bureau has historically defined near poverty as between 100 and 125 percent of the poverty line.[12]
We should also point out that some scholars reject the notion of “near poverty” as a quantifiable classification of economic status altogether. Robert Rector at the right-leaning Heritage Foundation, for instance, told the New York Times in 2011, “I don’t have any objection to this measure if you use the term ‘low-income.’ But the emotionally charged terms ‘poor’ or ‘near poor’ clearly suggest to most people a level of material hardship that doesn’t exist. It is deliberately used to mislead people.”[13]
Conclusion
Where does this leave us with Stein’s claim that “one in two Americans remain in or near poverty”? We found it to be untrue according to most conventional measures and definitions of near poverty. The official Census Bureau measure got us nowhere near 50 percent of the population when combined with any of the commonly used definitions of near poverty. Moreover, if we combined the SPM with the commonly-used definition of near poverty as between 100 and 150 percent of the poverty line, it comes out to only 32 percent of the population, or roughly one in three Americans.
Launched in October 2015 and active through October 2018, Fact Check by Ballotpedia examined claims made by elected officials, political appointees, and political candidates at the federal, state, and local levels. We evaluated claims made by politicians of all backgrounds and affiliations, subjecting them to the same objective and neutral examination process. As of 2025, Ballotpedia staff periodically review these articles to revaluate and reaffirm our conclusions. Please email us with questions, comments, or concerns about these articles. To learn more about fact-checking, click here.
Sources and Notes
- ↑ Jill2016.com, "The Precarious State of Our Union - A Bipartisan Disaster We Can Fix," January 12, 2016
- ↑ 2.0 2.1 Congressional Research Service, "Poverty in the United States: 2013," January 29, 2015
- ↑ 3.0 3.1 Institute for Research on Poverty, "How is poverty measured in the United States?" accessed January 25, 2016
- ↑ U.S. Census Bureau, "The Research Supplemental Poverty Measure: 2010," November 2011
- ↑ 5.0 5.1 U.S. Census Bureau, "Income and Poverty in the United States: 2014," September 2015
- ↑ 6.0 6.1 U.S. Census Bureai, "The Supplemental Poverty Measure: 2014," September 2015
- ↑ 7.0 7.1 Email exchange with Matthew Bruenig on January 19
- ↑ Reuters, "Number of working poor families grows as wealth gap widens," January 15, 2013
- ↑ Virginia Organizing, "Study: One in Three Virginia Children Lives in or Near Poverty," May 22, 2014
- ↑ Demos, "Retail's Choice: How Raising Wages and Improving Schedules for Women in the Retail Industry would benefit America," June 2, 2014
- ↑ American Enterprise Institute, "Using Linked Survey and Administrative Data to better measure Income: Implications for Poverty, Program Effectiveness and Holes in the Safety Net," October 26, 2015
- ↑ U.S. Census Bureau, "Living in Near Poverty in the United States: 1966 - 2012," May 2014
- ↑ New York Times, "Older, Suburban and Struggling, ‘Near Poor’ Startle the Census," November 18, 2011
Contact
More from Fact Check by Ballotpedia
| Republican candidates and Dodd-Frank December 17, 2015 |
| Incumbents and electoral competitiveness January 19, 2016 |
| Average retirement age for SCOTUS justices January 14, 2016 |
Follow us on Facebook and Twitter


